The Alliance Federation delivers Canada’s national advanced research computing (ARC) platform in partnership with regional digital research infrastructure (DRI) organizations (Compute Ontario, Calcul Québec, ACENET, the BC DRI Group and Prairies DRI) and institutions across Canada. Providing researchers with access to the infrastructure and expertise they need to accomplish globally competitive, data-driven and transformative research, this national ARC platform serves the needs of more than 20,000 researchers, including over 5,376 faculty based at Canadian institutions as of January 1, 2023.
For the 2023-2024 allocation period 2023, the total available capacity of the national ARC platform is 263,326 CPUs, 56,405 vCPUs (virtual CPUs), 2,569 GPUs and 190.5 PB of storage on Arbutus (University of Victoria), Cedar (Simon Fraser University), Graham (University of Waterloo), Niagara (University of Toronto), and Béluga and Narval (Calcul Québec). While close to 80% (on average) of the resources available are allocated through the RAC, we reserve a target of 20% for researchers to use through the Rapid Access Service (RAS), which grants all users access to modest quantities of compute, storage, and cloud resources as soon as they have an account.
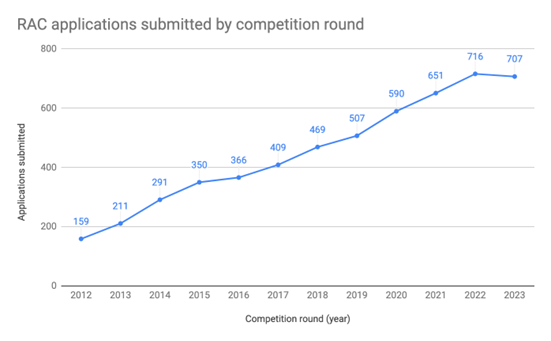
Ongoing growth in researcher demand for resources means that demand continues to outstrip supply. The 2023 RAC received 707 projects submitted. This year’s RAC was able to award 47% of the total compute requested, 80%% of the total storage requested, 20% of the total GPUs requested and 77% of the total vCPUs requested on the Arbutus, Béluga, Cedar and Graham clouds.
If you have questions about the terminology used in this page, please consult the Technical Glossary. If you have any questions about the overall report, contact allocations@tech.alliancecan.ca
Table 1: Applications Submitted to the Resource Allocation Competition
|
Year |
Applications submitted |
Year-over- year increase |
|
2023 |
707 |
-1% |
|
2022 |
716 |
10% |
|
2021 |
651 |
10% |
|
2020 |
590 |
16% |
|
2019 |
507 |
8% |
|
2018 |
469 |
15% |
|
2017 |
409 |
12% |
|
2016 |
366 |
5% |
|
2015 |
350 |
20% |
|
2014 |
291 |
38% |
|
2013 |
211 |
33% |
*Note: This report is based on the information available as of February 13, 2023.
Minimum Size of RAC Requests and Opportunistic Compute Access
A minimum of compute resources (currently set at 50 core-years for CPU and 10 GPU-years for GPUs) is required to be eligible to submit a RAC application. These minimum values are set in part to control the number of applications requiring peer-review. A minimum RAC award will also ensure higher job priorities than for non-RAC awardees.
All researchers and their sponsored users with an active account can automatically make opportunistic use of CPU and GPU resources on any system. There is no guarantee on how much CPU or GPU can be consumed by non-RAC holders, as their use of the systems is purely opportunistic.
Historical utilization data shows that many groups are able to reach (or even exceed) the RAC minimums specified above. Non-RAC users who want to maximize their compute usage need to consider strategies that ensure:
- they regularly have jobs in the queue;
- are able to tolerate longer wait times for jobs to start; and,
- submit jobs with “optimal” characteristics.
For example, opportunistic jobs with short time limits that request a few cores
on a general purpose (GP) system will generally run much sooner than those requesting dozens of cores.
Please read this useful documentation about allocation scheduling priorities and job scheduling policies or contact support@tech.alliancecan.ca for advice on how to maximize usage for non-RAC awardees.
CPU Allocations
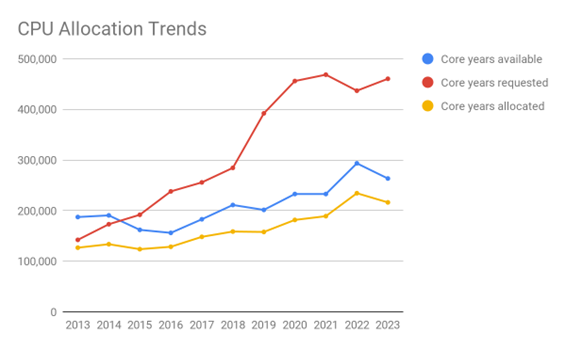
Based on available computing resources, RAC 2023 was able to meet 47% of all of the CPU requested, 7% less than last year. Béluga, Cedar, Graham, Narval and Niagara provide 100% of the available capacity or approximately 263,326 cores, of which close to 80% are available for RAC allocations.
Table 2: CPU Allocations per Cluster
|
Cluster |
Capacity: Available CPU (Core Years) |
Demand: CY requested |
Provided: CY allocated |
% of CPU capacity allocated |
|
Béluga |
28,960 |
44,784 |
22,970 |
79% |
|
Cedar |
68,976 |
127,430 |
56,191 |
82% |
|
Graham |
27,790 |
45,852 |
21,249 |
77% |
|
Narval |
61,760 |
96,133 |
49,866 |
81% |
|
Niagara |
75,840 |
153,800 |
65,888 |
87% |
|
Total |
263,326 |
467,999 |
216,164 |
82% |
Table 3: Historical CPU Demand vs. Supply
|
Year |
Capacity: Available CPU (Core Years) |
Demand: CY Requested |
Provided: CY allocated |
% of the demand allocated |
|
2023 |
263,326 |
460,346 |
216,164 |
47% |
|
2022 |
293,312 |
436,780 |
234,275 |
54% |
|
2021 |
232,704 |
468,498 |
188,925 |
40% |
|
2020 |
232,704 |
455,892 |
181,502 |
40% |
|
2019 |
201,320 |
390,352 |
157,262 |
40% |
|
2018 |
211,020 |
284,347 |
158,612 |
56% |
|
2017 |
182,760 |
255,638 |
148,100 |
58% |
|
2016 |
155,952 |
237,862 |
128,463 |
54% |
|
2015 |
161,888 |
191,690 |
123,699 |
65% |
|
2014 |
190,466 |
172,989 |
133,508 |
77% |
|
2013 |
187,227 |
142,106 |
126,677 |
89% |
Scaling CPU Requests
As previously stated, there were insufficient ARC resources to fully meet the CPU demand through RAC 2023.
As a result, a scaling function was applied to the 2023 competition to provide a means by which decisions on RAC allocations, in a context of insufficient capacity, could be made. This function, which is endorsed by the chairs of the review committees, was established so that only applications with a science score of 3.0 or higher (out of 5) received an allocation. Applicants who did not receive a CPU allocation can still make opportunistic use of system resources via the Rapid Access Service. The average score of all of the applications submitted to the RAC 2023 was 3.7.
CPU requests are scaled based on the overall score of the application and the size of the request. Details and examples of the scaling function are available here. For further questions, contact allocations@tech.alliancecan.ca.
GPU Allocations
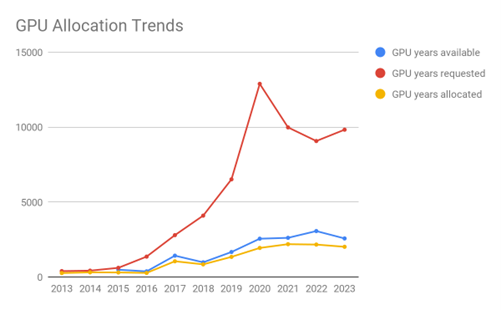
The demand for GPU resources continues to be more competitive than for CPU resources. As Tables 4 and 5 show, requests for GPUs have increased more than 3 fold in the last 5 years. The allocation rate in 2023 was 20%.
GPU allocations are determined by the following factors:
- the overall score of the RAC application,
- the technical justification provided,
- evidence of previous GPU utilization,
- the research area of application for which GPUs are requested (e.g., Artificial Intelligence, machine learning, etc.),
- the size of the research group.
Keep in mind the following:
- In general, RAC applicants find it difficult to estimate their GPU needs, which in most cases are over-requested (and underutilized). We strongly encourage future RAC applicants to do two things before applying: start using the GPUs in order to get a better understanding of their needs and consult with our technical staff. Our staff can provide advice on how to benchmark your codes and calculate your GPU needs as accurately as possible.
- GPU allocations are constrained, among other things, by the type of GPU (Pascal, Volta, T4) requested and available in each system.
- The demand for GPUs for AI applications has increased considerably.
Table 4: GPU Allocations per Cluster
|
Cluster |
Capacity: Available GPU (GPU Years) |
Demand: |
Provided: GPU Years allocated |
% of GPU capacity allocated |
|
Béluga |
688 |
2,708 |
546 |
79% |
|
Cedar |
1,014 |
3,208 |
781 |
77% |
|
Graham |
343 |
1,463 |
243 |
71% |
|
Narval |
524 |
2,447 |
442 |
84% |
|
Total |
2,569 |
9,826 |
2,012 |
78% |
Table 5: Historical GPU Demand vs. Supply
|
Year |
Capacity: Available GPU (GPUY) |
Demand: GPUY Requested |
Provided: GPUY allocated |
Difference |
% of the demand allocated |
|
2023 |
2,569 |
9,826 |
2,012 |
7,814 |
20% |
|
2022 |
3,062 |
9,070 |
2,161 |
6,909 |
24% |
|
2021 |
2,610 |
9,980 |
2,187 |
7,370 |
22% |
|
2020 |
2,552 |
12,885 |
1,936 |
11,165 |
15% |
|
2019 |
1,664 |
6,555 |
1,331 |
5,224 |
20% |
|
2018 |
976 |
4,092 |
840 |
3,252 |
20% |
|
2017 |
1,420 |
2,790 |
1,047 |
1,743 |
39% |
|
2016 |
373 |
1,357 |
269 |
1,088 |
20% |
|
2015 |
482 |
608 |
300 |
308 |
49% |
|
2014 |
NA |
420 |
308 |
112 |
73% |
|
2013 |
NA |
390 |
259 |
131 |
66% |
Storage Allocations
Storage integrated with Arbutus, Béluga, Cedar, Graham, Narval and Niagara provided approximately 190.5 PB of storage capacity for 2023. This meant that, across all types of storage, a total of 80% of available storage capacity was allocated.
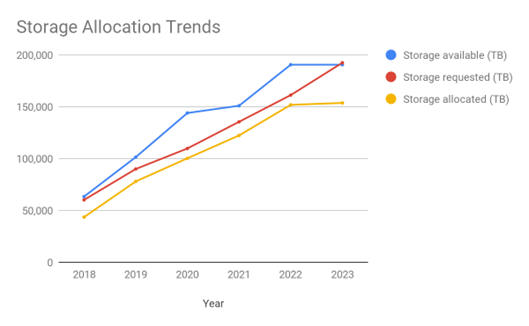
Table 6: Historical Storage Demand vs. Supply
|
Year |
Capacity: Available storage (TB) |
Demand: Storage requested (TB) |
Provided: Total storage allocated (TB) |
% of demand allocated |
|
2018 |
63,340 |
60,126 |
43,508 |
80% |
|
2019 |
101,344 |
89,898 |
77,923 |
94% |
|
2020 |
143,914 |
109,718 |
100,222 |
90% |
|
2021 |
150,915 |
135,427 |
122,272 |
91% |
|
2022 |
190,479 |
161,186 |
151,775 |
87% |
|
2023 |
190,479 |
192,363 |
153,639 |
72% |
Table 7: Allocations by Storage Type
|
Category |
Type |
Capacity: Available storage (TB) |
Demand: Storage requested (TB) |
Provided: Storage allocated (TB) |
% of the demand allocated |
|
HPC |
Project |
63,052 |
74,025 |
53,884 |
73% |
|
HPC |
Nearline |
97,800 |
84,348 |
71,827 |
85% |
|
HPC |
dCache |
13,680 |
14,140 |
13,740 |
97% |
|
Cloud |
Volumes and snapshot storage |
4,947 |
2,895 |
2,833 |
98% |
|
Cloud |
Object storage |
8,000 |
13,732 |
8,477 |
62% |
|
Cloud |
Shared cloud storage |
3,000 |
3,223 |
2,878 |
89% |
|
Total |
190,479 |
192,363 |
153,639 |
80% |
Cloud Allocations
The Arbutus cluster at the University of Victoria has 41,920 allocatable vCPUs (virtual CPUs). These are available via RAC and RAS and are also utilized for internal services such as software development and hosting. Relatively small cloud offerings are also implemented on Cedar, Graham and Béluga. For RAC 2023, the request for compute vCPUs overall increased by 3%: a 3% increase in the request for compute vCPUs and 44% increase for persistent vCPUs.
Overprovisioning of persistent vCPUs at a 10:1 ratio has allowed a significant expansion in persistent allocations in the previous few years. Demand for real cores has continued to increase, and aging equipment has begun to reduce available capacity; these pressures have pushed utilization numbers well over 80%, a threshold beyond which it becomes more difficult to schedule larger compute instances.
Between Arbutus and the additional nodes on Cedar, Graham, and Béluga, this year’s RAC was able to allocate 77% of the total virtual CPUs requested.
Table 8: Historical Cloud vCPU Demand vs. Supply
|
Year |
Capacity: vCPU Years available |
Demand: vCPU Years requested |
Provided: vCPU Years allocated |
% of demand allocated |
|
2023 |
56,405 |
35,618 |
27,313 |
77% |
|
2022 |
62,549 |
34,536 |
27,444 |
79% |
|
2021 |
62,549 |
30,323 |
24,443 |
81% |
|
2020 |
50,501 |
18,330 |
18,229 |
99% |
|
2019 |
29,147 |
19,479 |
18,511 |
95% |
|
2018 |
24,854 |
12,480 |
11,829 |
95% |

The RAC involves two review processes each year:
- a scientific review, which is a peer-review process involving more than 100 discipline-specific experts from Canadian academic institutions. These volunteers assess and rate the merits of the computational research projects submitted. The scientific review results in a single score that provides a critical and objective measure to guide allocation decisions; and
- a technical review that is undertaken by staff who are responsible for verifying the accuracy of the computational resources needed for each project based on the technical requirements outlined in the application and for making recommendations about the national system to which the resources should be allocated to meet the project's needs.
The overall process is overseen by the Resource Access Program Administrative Committee, which includes representatives from each region and national system host sites.
Note that while new applications receive both scientific and technical reviews, applications submitted via the Fast Track process and Research Platforms and Portals (RPP) with a multi-year award receive only a technical review.
Guiding Principles
RAC is guided by the following principles:
- all applications are given fair consideration through both a scientific and technical review process;
- resources are awarded based on the merits of the computational research project presented, rather than the merits of the overall research program;
- there is no direct correlation between the amount of computational resources needed and the quality (excellence) of the research outcomes of a project - important research can be done with a small amount of computational resources; and
- the challenges arising from the shortage of resources and other constraints within the system are shared among all applicants.
Technical Review
The technical review is conducted by technical experts who:
- ensure the appropriate system is requested by the PI and the required software is available;
- evaluate application efficiency and scalability;
- identify groups that may need help with application and workflow optimization;
- identify discrepancies between the online request and the complete description of the project;
- identify special software requirements; and,
- provide a technical opinion on the reasonableness of the request.
Technical reviewers are required to sign a Non-Disclosure Agreement prior to accessing any RAC application.
Science Review
New applications submitted to the RAC are peer-reviewed and scored. Scientific reviewers are required to sign a Non-Disclosure Agreement and accept the Conflict of Interest Policy prior to accessing any RAC application.
The final RAC score is based on the following:
- the scientific excellence of the specific research project for which computational resources are being requested;
- the scientific and technical feasibility of the proposed research project;
- the appropriateness of the resources requested to achieve the project’s objectives; and,
- the likelihood that the resources requested will be efficiently used.
Applications are reviewed in one of the committees below:
- Astronomy, Astrophysics and Cosmology
- Bioinformatics
- Chemistry, Biochemistry and Biophysics
- Computer Sciences and Mathematics
- Engineering
- Environmental and Earth Sciences
- Humanities and Social Sciences
- Nano, Materials and Condensed Matter
- Neurosciences, Medical Imaging and Medical Physics
- Subatomic Physics, Nuclear Physics and Space Physics
These values represent an average across the national ARC platform’s facilities and include total capital and operational costs incurred to deliver the resources and associated services. These are not commercial or market values. For the 2023 competition, the value of the resources allocated was calculated using the following rates:
Table 9: Financial Value of RAC Awards
|
Resources |
2023 |
|
1 core year |
$104.09 |
|
1 GPU year |
$2,564.16 |
|
1 TB of project storage / year |
$57.29 |
|
1 TB of nearline / year |
$25.66 |
|
1 vCPU year |
$37.86 |
|
1 VGPU year |
$615 |
|
1 TB of volume and snapshot storage (Ceph) / year |
$49.18 |
|
1 TB of object storage |
$49.18 |
|
1 TB of shared filesystem storage |
$49.18 |