CPU Allocations
Based on available computing resources, RAC 2020 was able to meet 40% of all the CPU (core year) requested—this is the same allocation rate as last year. Cedar, Graham, Niagara and Béluga provide 100% of the available capacity or approximately 233,000 cores, of which close to 80% are available for RAC allocations. This resulted in a modest increase of almost 30,000 available cores compared to last year, despite the decommissioning of the MP2 system, which removed approximately 30,000 cores from the available pool of resources.
Table 2: 2020 Compute Allocations per System
| CPU Resource |
Supply: Allocatable Core Years (100% capacity) |
Need: Total Core Years Requested |
Provided: Total Core Years Allocated |
% of CPU Capacity Allocated |
| Béluga |
28,000 |
55,894 |
22,807 |
81% |
| Cedar |
94,528 |
182,224 |
70,605 |
75% |
| Graham |
34,336 |
64,068 |
24,780 |
72% |
| Niagara |
75,840 |
153,706 |
63,308 |
83% |
| Total |
232,704 |
455,892 |
181,502 |
78% |
As of February 20, 2020
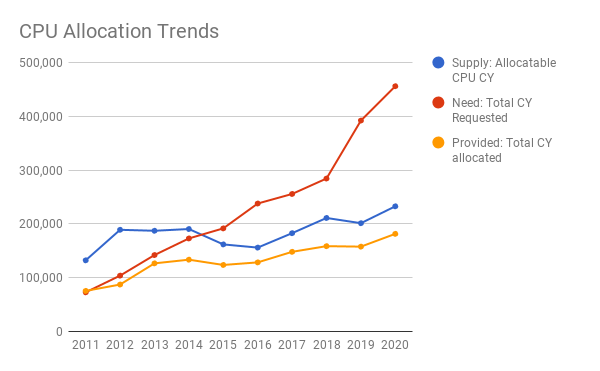
Table 3: Historical Compute Ask vs. Allocation
| Year |
Supply: Allocatable CPU Core Years |
Need: Total Core Years Requested |
Provided: Total Core Years Allocated |
Shortfall Capacity Core Years |
% of the Demand Awarded |
| 2020 |
232,704 |
455,892 |
181,502 |
274,390 |
40% |
| 2019 |
201,320 |
390,352 |
157,262 |
233,089 |
40% |
| 2018 |
211,020 |
284,347 |
158,632 |
129,325 |
56% |
| 2017 |
182,760 |
255,638 |
148,100 |
107,538 |
58% |
| 2016 |
155,952 |
237,862 |
128,463 |
109,399 |
54% |
| 2015 |
161,888 |
191,690 |
123,699 |
67,991 |
65% |
| 2014 |
190,466 |
172,989 |
133,508 |
39,481 |
77% |
| 2013 |
187,227 |
142,106 |
126,677 |
15, 429 |
89% |
| 2012 |
189, 024 |
103, 845 |
87, 312 |
16, 533 |
84% |
Scaling for CPU Requests
As described above, there were insufficient ARC resources to fully meet the CPU demand through RAC 2020.
As a result, a scaling function was applied to the 2020 competition to provide a means by which decisions on RAC allocations, in a context of insufficient capacity, could be made. This function, which is endorsed by the Chairs of the review committees, was set so that only applications with a science score of 2.5 or higher (out of 5) received an allocation. Applicants who did not receive a compute allocation can still make opportunistic use of system resources via the Rapid Access Service. The average score of all the applications submitted to the RAC 2020 was 3.5.
CPU requests are scaled based on the overall score of the application and the size of the request. Details and examples of the scaling function are available here. For further questions, contact rac@computecanada.ca.
Minimum size of RAC requests and opportunistic compute access
All researchers and their sponsored users with an active Compute Canada account can automatically make opportunistic use of CPU and GPU resources on any system. (This ability to compute without an allocation is also referred to as the Rapid Access Service). However, the priority of these jobs will be lower than that of jobs submitted by those researchers who have RAC awards. There is no guarantee on how much CPU or GPU can be consumed by non-RAC holders, as their use of the systems is purely opportunistic.
The RAC application process requires a minimum ask amount for compute resources (currently set at 50 core-years for CPU and 10 GPU-years for GPUs). These minimum values are set in part to control the number of applications requiring peer-review. As the number of applications increases every year, the workload of the expert review committees increases proportionally. Therefore, a RAC award made at the minimum level is a true RAC award and will ensure higher job priorities than for any non-RAC awardee.
While usage by non-RAC awardees is opportunistic, historical utilization data shows that many groups are able to reach (or even exceed) the RAC minimums specified above. Non-RAC users who want to maximize their compute usage need to consider strategies that ensure:
- they regularly have jobs in the queue;
- are able to tolerate longer wait times for jobs to start; and,
- submit jobs with “optimal” characteristics.
For example, opportunistic jobs with short time limits that request a few cores on a GP system will generally run much sooner than those requesting dozens of cores.
Please read this useful documentation about allocation scheduling priorities and job scheduling policies or contact support@computecanada.ca for advice on how to maximize usage for a non-RAC awardee.
GPU Allocations
The demand for GPU resources continues to be more competitive than for CPU resources. As Tables 4 and 5 show, requests for GPUs have increased almost 10 fold since 2016. In 2020, 888 new GPU devices became available. Due to increased demand for GPU resources, the allocation rate in 2020 was 26%, 6% higher than in 2019.
GPU allocations are determined by the following factors: the overall score of the RAC application, the technical justification provided, evidence of previous GPU utilization, the research area of application for which GPUs are requested (e.g., Artificial Intelligence (AI), machine learning, etc.), and the size of the research group.
Keep in mind the following:
- In general, RAC applicants find it difficult to estimate their GPU needs, which in most cases are over requested (and underutilized) by an important factor. We strongly encourage future RAC applicants to do two things before applying: start using the GPUs in order to get a better understanding of their needs and consult with our technical staff. Our staff can provide advice on how to benchmark your codes and calculate your GPU needs as accurately as possible.
- GPU allocations are constrained, among other things, by the type of GPU (pascal, voltas, T4) requested and available in each system.
- For RAC 2020, most applications requested GPUs on Béluga because originally it was the only location with voltas. However, the recent expansion on Cedar with voltas significantly increased the GPU capacity on that location.
- The demand for GPUs for AI applications has increased considerably.
Table 4: 2020 GPU Year Allocations per System
| GPU Resource |
Supply: Allocatable GPU Years (100% capacity) |
Need: GPU Years Requested |
Provided: Total GPU Years Allocated |
% of GPU Capacity Allocated |
| Béluga |
688 |
4,453 |
551 |
80% |
| Cedar |
1,352 |
5,967 |
978 |
72% |
| Graham |
440 |
2,301 |
358 |
81% |
| Helios |
72 |
164 |
49 |
68% |
| Total |
2,552 |
12,855 |
1,936 |
76% |
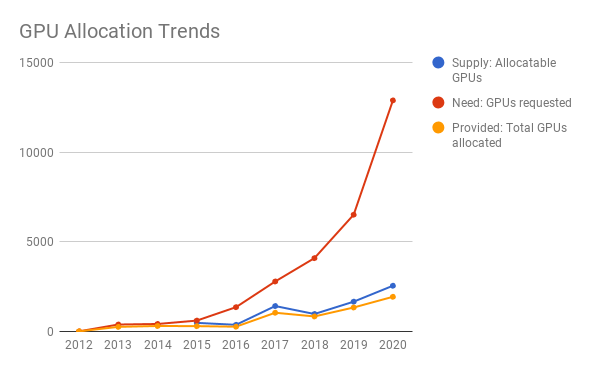
Table 5: Historical GPU demand vs. supply (GPU years)
| Year |
Supply: Allocatable GPUs |
Need: GPUS Requested
|
Provided: Total GPUs Allocated |
Shortfall Capacity GPUs |
% of the Need Awarded |
| 2020 |
2,552 |
12,885 |
1,936 |
11,165 |
15%* |
| 2019 |
1,664 |
6,555 |
1,331 |
5,224 |
20.3% |
| 2018 |
976 |
4,092 |
840 |
3,252 |
20.5% |
| 2017 |
1,420 |
2,790 |
1,047 |
1,743 |
37.5% |
| 2016 |
373 |
1,357 |
269 |
1,088 |
19.8% |
| 2015 |
482 |
608 |
300 |
308 |
49.3% |
| 2014 |
n/a |
420 |
308 |
112 |
73.3% |
| 2013 |
n/a |
390 |
259 |
131 |
66.4% |
| 2012 |
n/a |
10 |
10 |
0 |
100% |
*The total 2020 GPU ask includes a very large request from a single application—absent this ask, our GPU allocation rate is 26% instead of 15%.
Cloud Allocations
The Arbutus cluster at the University of Victoria has 29,824 allocatable virtual CPUs. These are available via RAC and RAS and are also utilized for internal Compute Canada services such as software development and hosting. Relatively small cloud offerings are also implemented on Cedar, Graham and Béluga. For RAC 2020, the request for virtual CPUs overall decreased by 6%: a 41% increase in compute vCPU was slightly offset by a 62% decrease in persistent vCPU.
This apparent net drop in requests is in part the result of a change in the available VM (or virtual machine) definitions on Arbutus, which encouraged users to select VMs configured with fewer vCPUs to more accurately reflect their actual utilization relative to memory. It’s also partly because a number of larger allocations have adjusted their 2020 RAC requests to accurately reflect their initial years’ core utilization. These allocations all project significant core growth in the immediately following years, so we do not expect a trend of decreasing demand going forward. Deploying a complex platform can take longer than a research group estimates, and there is not enough support available for these groups.
Overprovisioning of persistent vCPUs at a 10:1 ratio has allowed a significant expansion in persistent allocations in the previous few years. Even with the slightly reduced numbers this year, demand for real cores has continued to keep pace with hardware expansions with utilization numbers well over 80%, past which scheduling larger compute instances becomes difficult. In practice, this has meant that there is frequent contention for real CPUs, and the current phase 3 expansion of Arbutus only temporarily alleviates that contention.
A significant amount of cloud resources are allocated through the RAS process. In 2019, almost 2700 vCPUs were requested via RAS, a 68% increase over 2018. In total, over 6,000 vCPUs are allocated via RAS currently. Between Arbutus and the additional nodes on Cedar, Graham, and Béluga, this year’s RAC was able to allocate 99% of the total virtual CPUs requested. In total, cloud storage was allocated at 72% of its capacity for 2020.
Storage Allocations
Storage integrated with Cedar, Graham, Arbutus, Niagara and Béluga provided approximately 167 PB of storage capacity for 2020. This meant that, across all types of storage, the CCF was able to allocate a total of 85% of its available storage capacity.
Table 6: 2020 Storage Need vs. Supply by Storage Type (TB)
| Storage Type |
Supply |
Need: Storage Requested TB |
Provided: Storage Allocated |
% of the Demand Awarded |
| Project |
57,030 |
56,867 |
40,732 |
72% |
| dCache |
14,804 |
10,200 |
10,200 |
100% |
| Cloud |
4,280 |
3,920 |
3,062 |
78% |
| Nearline |
67,800 |
43,347 |
44,650 |
103% |
| Total |
143,914 |
114,334 |
98,645 |
86% |
*A portion of the /project storage allocations were moved to nearline due to capacity constraints.